Illusive Green function for the domain of Finance
The theory of the idea is to set backwards into the definition of Green’s function. In short, the Green function is a response function to a change in a system. Lets put aside the domain and topology of such system, as we usually work in well defined L2 space. When I first encountered the concept of a function like this, the strong repercussions were evident. Its like having a deciphiring machine to a complex puzzle. Whats fascinating is the idea that it can be done to any puzzle. If your point is a disturbance into a biological system of bacteria, you’ll know how the population is affected. If your point is a stock price, you’ll know how to price a derivative of the stock at any time. If you’re fast enough, you’ll do this continuously and capture the difference.
The question that comes naturally, is what may we do to find this function. I implicitly jumped to a model approach and possibily a non-parametric approach, comes down to combinatorial matters. The idea of what stock to study, under what regime, and what factors that affect the regime, to the greeks of the derivative of the stock. the problem explodes in dimension.
Lets look at the green function in the general sense:
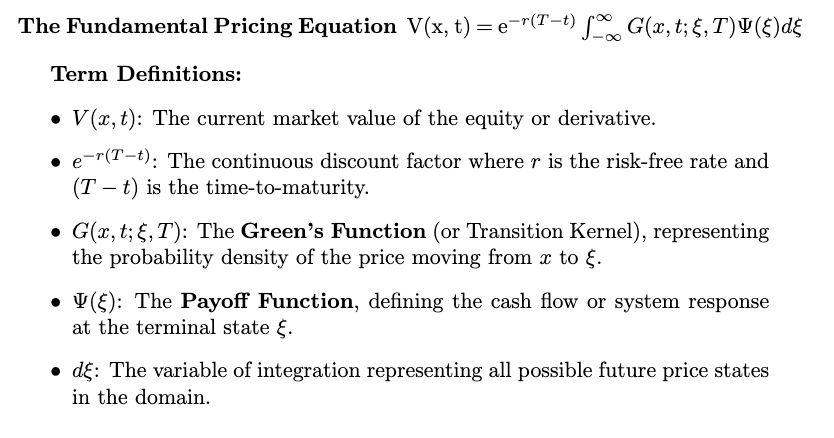
Now lets imagine two changes in ‘x’ and how the price of the derivative changes. Since the integral is linear, any difference will add up and scale linearly. This is the mathematical explanation, but how does it stack up against real time behavior? A recent example in mind would be NVDA earning reports and stock price reaction. These are not linear where one cannot say that the relationship between an earnings shock and the stock price change is linear let alone positive.
So a pure green function approach may not be the proper way
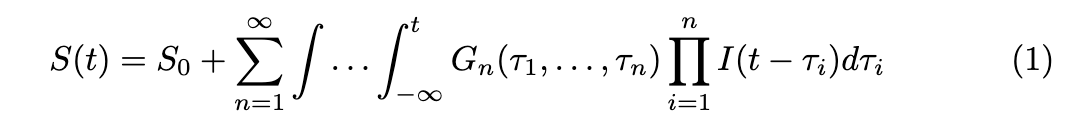
We can propose a solution in the form of Volterra series. The idea is to think of a price impact in several dimensions, one is the initial jump, followed by decay speed, then by oscillations.
The proposed project is the following:
Input data sources of stock prices, derivatives data, and possibly systematic market data
polyfit these features or use a neural network approach
study volatile times and how the response functions are affected
From a mathematical persepctive, this will be in the finite domain. the space will be a differentiable manifold and extended to a Sobolev space. we want our kernels to not blow up. Obviously we would work in bounded prices, especially if we would look into exotic options like Barrier options